


A/B testing results only provide valuable insights for decision-making when they are translated into readable data. Many Shopify teams run dozens of experiments but struggle to translate A/B testing results into conversion rate, revenue, and customer experience.
This guide explains how to read, validate, and apply A/B testing results so every experiment moves your store forward.
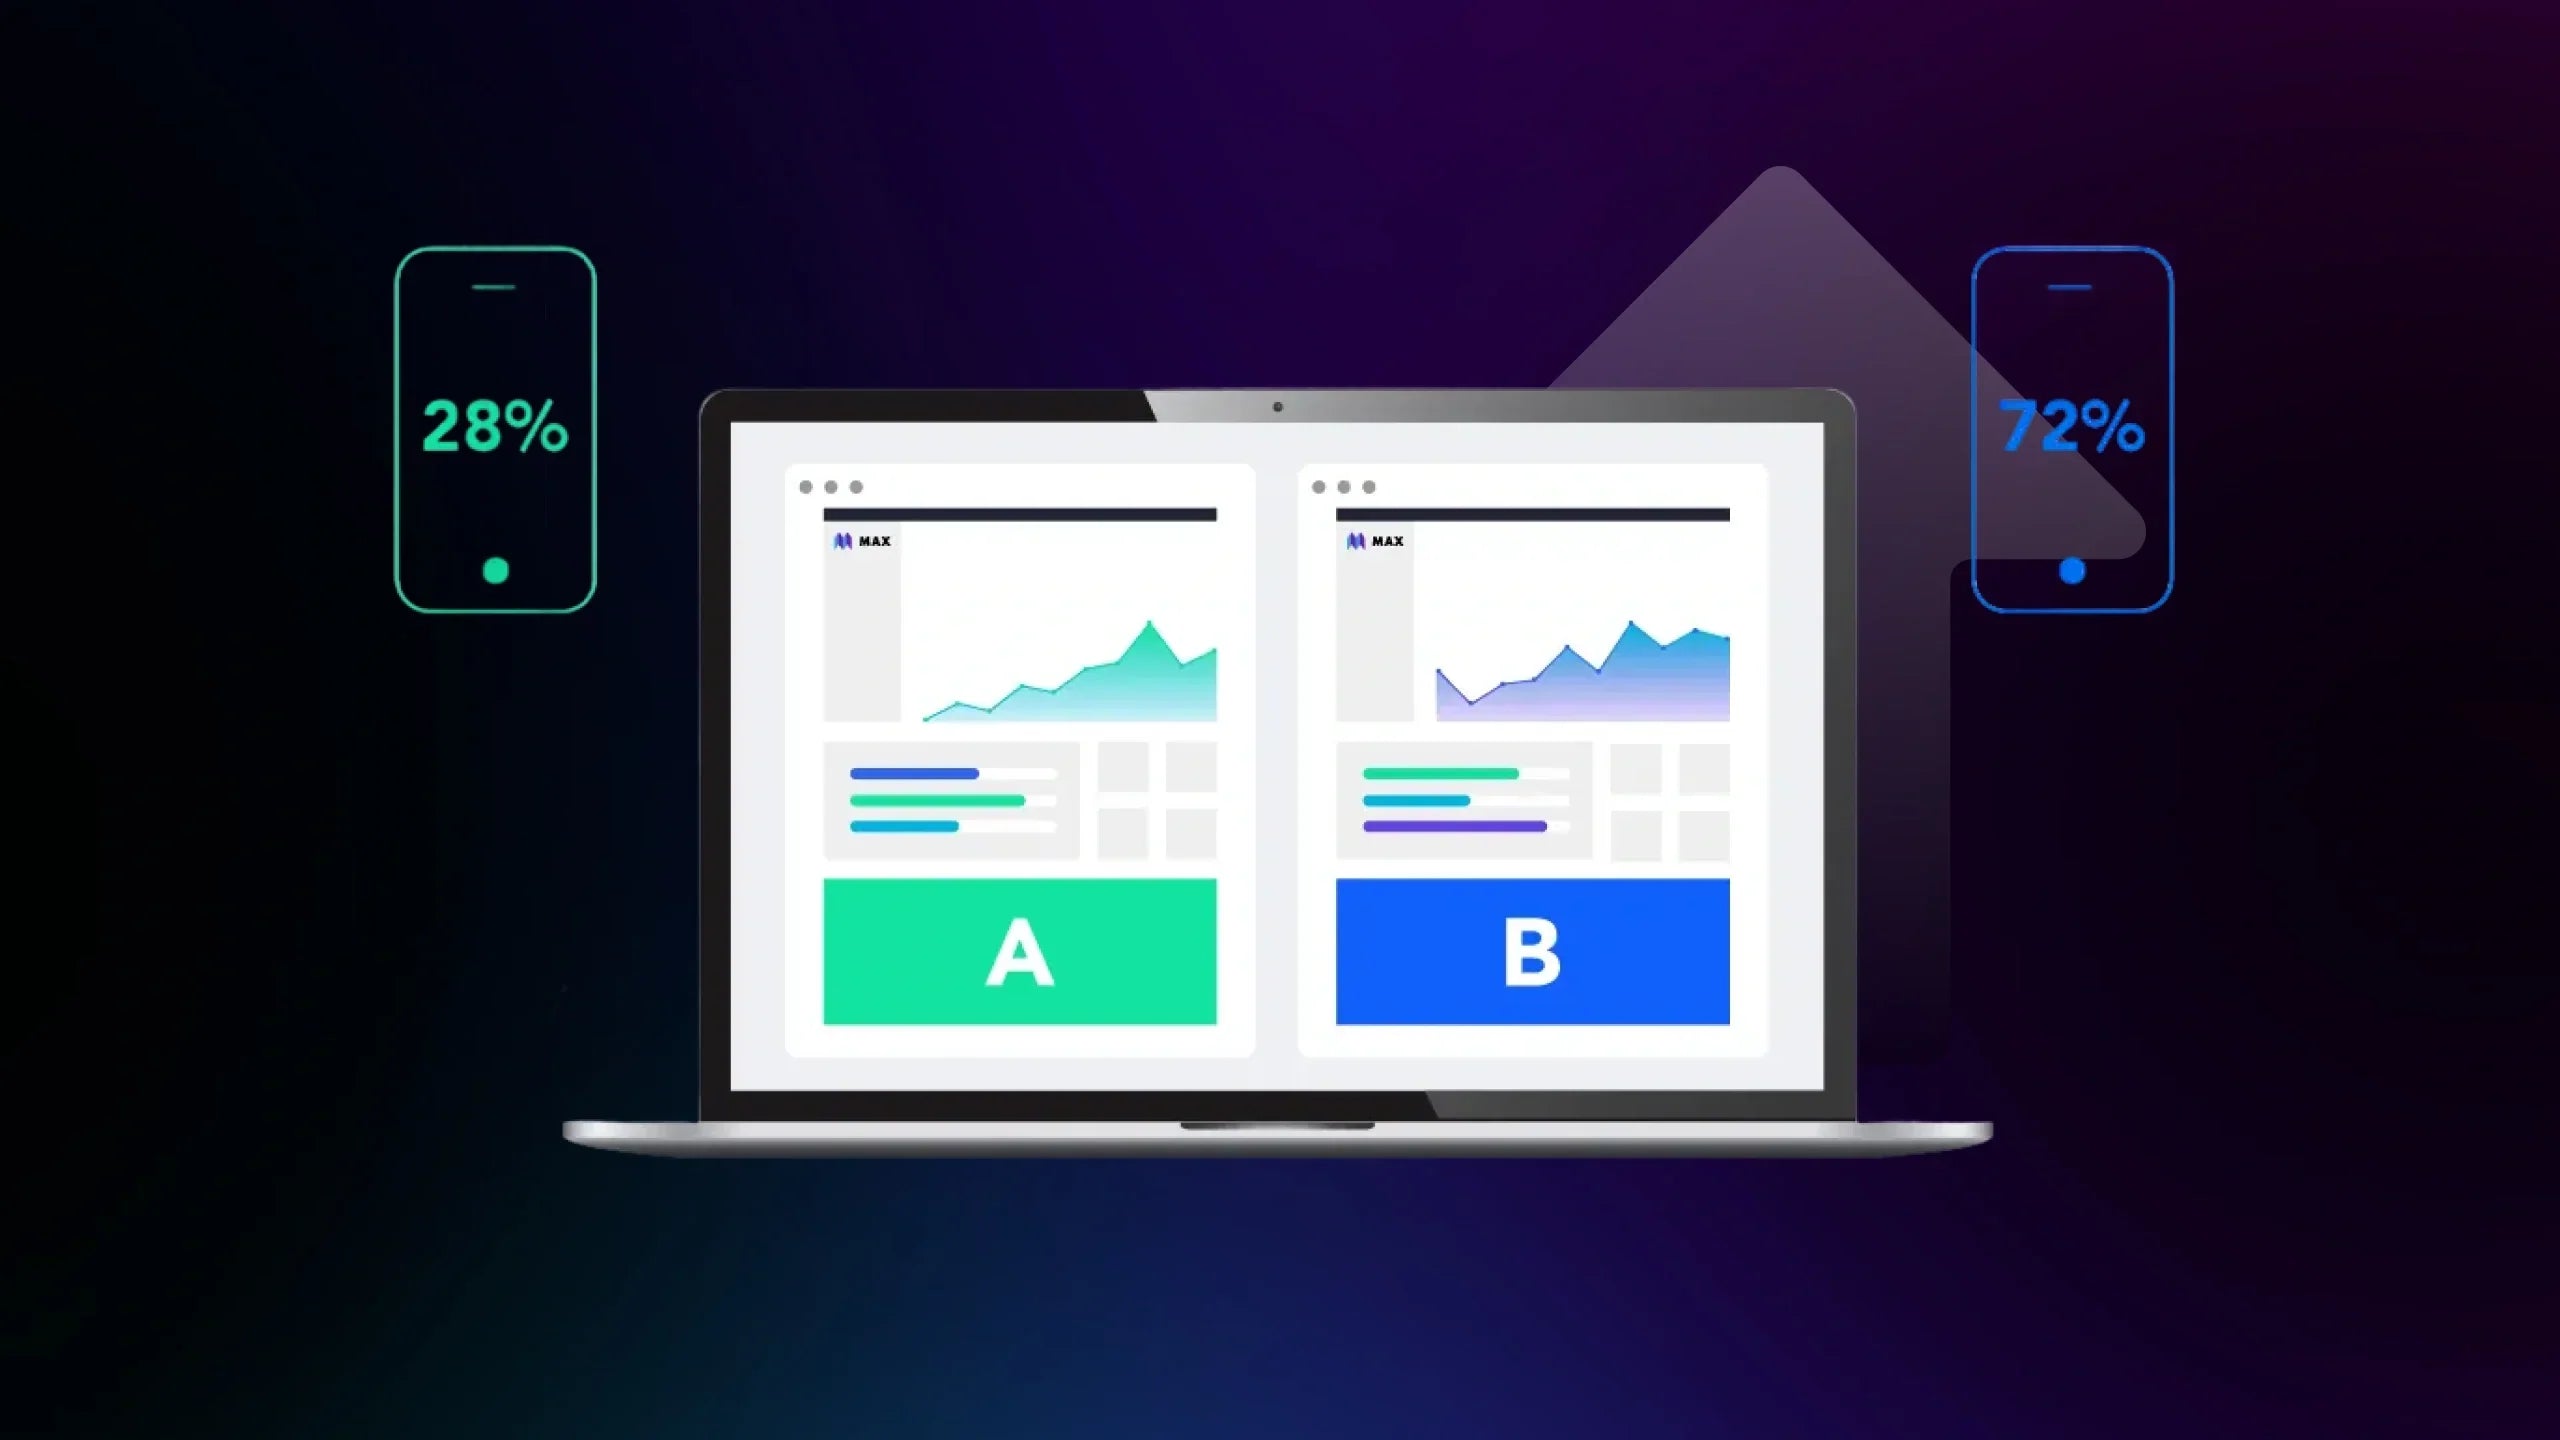
What is A/B Testing?
A/B testing is the process of running controlled experiments to produce valid testing results to guide business decisions. To support wise decisions, A/B testing results should be collected across multiple funnels from product pages, blogs, checkout, and other landing pages. Data such as scroll habits, time-on-page, checkout completion, or bounce rate all show how each channel influences customer on-page engagement, behavior, and conversion.
The purpose of A/B testing is not simply to declare a winner. It is to use testing results to understand what motivates customers to buy, what causes hesitation, and which experiences create the highest commercial impact.

Why You Need to Accurate A/B Testing Results

A/B testing helps to shape how a store evolves. When results from this experiment are misread, merchants often scale the wrong ideas and unknowingly hinder performance. Reading accurate A/B testing results helps merchants:
- Avoid false positives
Some variations look promising early but fail once enough data is collected. Acting on early trends often leads to rolling out changes that hurt performance.
Example: After two days, Variant B shows a 15% higher conversion rate, but after a full two-week cycle, revenue per visitor drops significantly. Ending the test early would have locked in a weak design.
- Support decision-making
Reliable experiment data replaces guesswork with solid data to help validate business goals and drive long-term impacts.
Example: The marketing team prefers a bold headline, while the product team favors a benefit-driven one. A/B test shows a benefit-focused headline increases add-to-cart rate by 9%. Teams can now make confident changes to performance.
Learn more: GemX Use Case Series: AB Test Multiple Headlines
- Interpret customer behavior
Test results show how visitors respond to pricing, messaging, trust elements, and page structure. These indicate friction and provide insights into how to remove these frictions.

Source: Picreel
Example: An A/B test on homepage CTAs shows that "Sign up for free" CTA raises conversion rate by 2.6%. This result suggests that this is a valid change to boost conversion.
- Ensure experiment validity
Poorly designed tests produce misleading conclusions. Clean tracking, sufficient traffic, and stable conditions are required for results that can be trusted.
Example: If one variant loads slower due to an image optimization issue, it may perform worse even though the design is better. Without monitoring page speed and tracking accuracy, the test outcome would be invalid.
- Facilitate sustainable growth
When insights from experiments are dependable, merchants can optimize continuously without taking unnecessary risks or disrupting their revenue base.
Example: A store that validates each new upsell design through testing can steadily increase average order value without pushing aggressive layouts that scare away loyal customers.
- Maximize resources
Every test uses traffic, time, and attention. High-quality findings ensure those investments translate into meaningful improvements.
Example: Instead of testing five random color changes, a merchant tests a high-impact element like the colours of CTA. A well-designed test can generate more revenue than many shallow experiments combined.
6+ Practical Tips to Read and Act On A/B Test Analytics
Interpreting A/B testing results requires more than simply comparing the numbers. Reliable insights come from using the right metrics, validating statistical confidence, and understanding how different customer segments behave. The following six tips provide a structured way to evaluate performance, avoid misleading conclusions, and turn experimental data into profitable decisions.
#1. Measure the Right Success Metrics
Accurate analysis begins with choosing metrics that yield real business impact rather than shallow engagement. Many merchants focus on conversion rate, but there are more metrics that help boost revenue and customer experience.

Primary metrics are the ones that directly affect revenue and growth. These include:
-
Conversion rate
-
Revenue per visitor
-
Checkout completion rate
-
Add-to-cart rate
They tell you whether a change is improving the efficiency of the funnel. For example, a product page variation might raise add-to-cart by 12%, but if checkout completion falls, total revenue may still decline.
Secondary metrics provide context for why performance changes. Metrics include:
-
Average order value
-
Time on page
-
Scroll depth
-
Click-through rate
-
Bounce rate
Learn more: How to Configure the Advanced Settings and Define Winning Metrics
These metrics help explain user behavior. If a new layout increases time on page but lowers conversions, it may indicate confusion rather than engagement.
#2. Confirm Statistical Significance
Confirming that testing results are statistically significant is a crucial step. Merchants need to ensure that the performance difference is large enough and is supported by enough data.
The standard confidence level should be 95% and the p-value should stay below 0.05 to ensure test validity. Any number below this threshold should not be treated as a reliable result.
False winners and false losers usually appear early in tests. Traffic patterns fluctuate by hour, day, and marketing activity. A variant might look strong after two days, then collapse once weekend traffic or email campaigns enter the data.
To avoid this:
-
Never stop a test before it reaches statistical significance.
-
Do not declare a winner based on early conversion spikes.
-
Wait until traffic volume and conversion rates stabilize across multiple days.
Only when the test is statistically significant should results be used for further decisions.
#3. Validate Sample Size and Test Duration
Even a well-designed test will fail if it collects insufficient samples. Small samples may drive misleading results because a few conversions can distort the data.
To yield valid results, an experiment should run for at least 14 days. This ensures that user behavior is not skewed by short-term fluctuations or other external influences. Longer tests are often needed for stores with lower traffic.
Merchants can use calculators to define their sample size in accordance with their business goals. For example, if a store converts at 2% and wants to have a 10% lift, it may need a sample of tens of thousands to produce reliable results.
#4. Check for External and Internal Influences

Not all performance changes come from the test. Many external and internal factors can distort data and make results appear better or worse than they really are.
External influences include:
-
Paid campaigns starting or stopping
-
Email and SMS promotions
-
Seasonal demand or holidays
-
Traffic surges from influencers
For example, if Variant B launches the same day as a major email campaign, it may receive higher-intent traffic and falsely appear to outperform Variant A.
Internal influences include:
-
Slow page speed
-
Broken buttons or checkout errors
-
Theme or app conflicts
-
Tracking failures or pixel misfires
A single broken checkout button can reduce conversions by 20–30% and invalidate the entire test. That is why technical monitoring and traffic consistency must be checked throughout the test period. Merchants can use analytics tools to check performance before proceeding.
#5. Segment Users to Uncover Deeper Insights
However, testing results can hide important performance patterns if visitors are grouped into one dataset. Segmenting A/B testing results allows merchants to understand how different audiences respond to a variant and where real revenue impact is coming from.

Key segmentation dimensions
Different customer groups behave differently throughout the Shopify funnel, which means A/B testing results must be interpreted within each segment. The most valuable segmentation layers include:
-
Mobile vs. Desktop users
Mobile users usually face more friction during navigation and checkout. Desktop users convert at higher rates and with larger orders. A test may show flat overall A/B testing results, yet reveal a +9% conversion lift on desktop and a −4% drop on mobile due to usability issues.
-
New vs Returning visitors
New visitors depend on trust, clarity, and education. Returning users respond more to pricing and urgency. A landing page variant may raise first-time visitor conversions from 1.3% to 1.8, while A/B testing results for returning users remain unchanged.
-
Paid traffic vs Organic traffic
Paid visitors arrive with strong intent shaped by ad copy. Organic users are often still comparing options. A/B testing results frequently show that ad-driven users convert better when the page closely mirrors the ad message.
-
Geographic regions
Location influences shipping expectations, currency sensitivity, and trust signals. A/B testing results may show a 10% uplift in US traffic but a 6% decline in Europe due to unclear tax or delivery information.
-
High-value vs Low-value customers
Some customers consistently generate more revenue. A promotion-heavy variant may increase total conversions, but A/B testing results could reveal that high-value buyers reduce spending, lowering revenue per visitor.
Why Segmentation is Important
Raw A/B testing results rarely tell the full story. A variant that appears neutral overall may be a strong winner for profitable users and a loser for low-intent traffic. Without segmentation, these effects cancel out, and the test is wrongly labeled as inconclusive. Segmented A/B testing results allow merchants to:
-
Deploy winning variants only to audiences where they create value
-
Identify which users are most sensitive to layout, pricing, or trust signals
-
Design follow-up experiments that target specific behavioral gaps
Over time, segmentation turns A/B testing results into a strategic growth engine. Instead of optimizing for average visitors, Shopify merchants can optimize for the customers who actually drive profit.
Learn more: How to Turn Your Tests Into Real Conversion Gains
#6. Decide What To Do With the Test Results
There are many cases of merchants who toss aside failed experiments; however, even failure can be documented for further analysis and improvement.
When there is a clear winner, the winning variant should be rolled out across all traffic. This is where growth happens. Winning changes should improve conversion rate, increase revenue per visitor, and reduce funnel drop-off. These gains then compound as future tests build on the improved baseline.
When a variant loses, it should not be discarded without analysis. Losses reveal what customers do not want. That prevents repeating the same mistake and helps shape more effective designs in future experiments. Systematic learning is what turns experimentation into a long-term growth engine.
Learn more: How to Read Experiment Results in GemX
Common Mistakes when Analyzing Your A/B Test Reports
Even when experiments are well executed, poor interpretation can lead to costly decisions. Many Shopify stores lose revenue not because testing failed, but because the outcomes were misunderstood or acted on incorrectly.

- Ending experiments too early
Stopping a test as soon as one variation looks better is one of the most damaging mistakes. Early results are often influenced by temporary traffic spikes, campaign timing, or random user behavior. A version that appears to outperform in the first few days may lose out once traffic normalizes. Valid conclusions require stable conversion and revenue patterns over time. Ending tests before data settles increases the risk of selecting a false winner and rolling out changes that reduce long-term performance.
- Testing too many elements at the same time
When multiple elements are changed at once, it becomes impossible to identify what actually drives the performance difference. Even if a variation wins, the result cannot be reused or scaled because the source of improvement is unclear. Effective testing depends on controlled comparisons. Isolating changes ensures that each result produces meaningful insight that can guide future optimization.
- Ignoring negative or neutral results
Many teams only value experiments that show a clear lift. However, variations that perform worse or show no change are just as important. They reveal which messages, designs, or offers fail to motivate customers. These outcomes help eliminate weak ideas and refine future tests. When losses are ignored, teams repeat the same mistakes and waste traffic on unproductive experiments.
- Failing to document learnings
Without a structured record of experiments, insights disappear. Teams forget what was tested, why it was tested, and what was learned. This leads to repeated experiments, conflicting site changes, and slow optimization progress. Documenting results creates continuity. Over time, it builds a knowledge base that guides smarter test design, reduces risk, and increases experiment efficiency.
Conclusion
Interpreting A/B testing results correctly is what separates profitable optimization from costly guesswork. When metrics, sample size, statistical confidence, and user segments are all evaluated together, merchants gain a reliable view of what actually improves conversion and revenue.
For Shopify stores, strong A/B testing results create a repeatable system for growth. Each experiment builds on the last, allowing teams to refine messaging, layout, and offers based on real customer behavior instead of assumptions. Over time, this disciplined approach reduces risk and turns testing into a long-term competitive advantage.
FAQs about A/B Testing Results


