


- What is a Heatmap Tool for Shopify
- Why Heatmap Tools Matter for Your Business?
- Top 12 Heatmap Tools to Scale Your Shopify Store
- How to Choose the Right Heatmap Tools for Your Store
- Heatmap tools and A/B testing: Turn insights into impacts
- Common Mistakes When Using Heatmap Tools
- Conclusion
- FAQs about Heatmap Tools
Understanding how visitors actually interact with your store is no longer optional as competition on Shopify increases. Heatmap tools help merchants visualize user behavior at scale, making it easier to identify friction, improve conversion paths, and support data-driven growth decisions.
What is a Heatmap Tool for Shopify
Heatmap tools translate user interactions into visual data layers that show where visitors click, scroll, pause, or ignore content. Instead of relying only on numerical metrics, merchants gain a clear view of behavioral patterns across product pages, landing pages, and checkout flows.
For Shopify stores, heatmap tools are commonly used to evaluate page structure, content placement, and interaction depth. They reveal whether key elements such as calls-to-action, product images, trust badges, or navigation menus receive attention or are overlooked. When combined with marketing analytics and testing, heatmap data can strongly support CRO and UX improvement.
3 Types of Heatmap Tools You Should Know

- Click heatmaps
Click heatmaps show where users click or tap on a page. For Shopify stores, they help confirm whether key elements such as add-to-cart buttons, product options, navigation, and trust signals receive attention. They also reveal misleading layouts when users click non-interactive elements, signaling usability issues. Click heatmaps are most useful for improving CTA placement, page layout, and navigation clarity.
- Scroll heatmaps
Scroll heatmaps display how far visitors scroll and where engagement drops. This helps merchants assess whether important content like pricing, reviews, or shipping information appears too late on the page. Scroll data supports decisions around content order, page length, and section prioritization, especially for long product pages and mobile experiences.
- Movement heatmaps
Movement heatmaps track cursor movement to indicate user attention and hesitation on desktop devices. They help identify areas where users pause or revisit before acting, such as pricing or CTAs. While indirect, this data adds context to click and scroll insights and is best used to support UX and checkout optimization analysis.

Why Heatmap Tools Matter for Your Business?
Heatmap tools provide context that traditional analytics often lack. Instead of guessing why a page underperforms, merchants can observe behavioral evidence and make informed improvements.
-
Understanding on-page user behavior:
Show how visitors interact with actual page elements, including where they click, how far they scroll, and which sections attract attention. This helps merchants evaluate whether key messages, products, and CTAs are seen and engaged with as intended.
-
Identifying friction points that drive bounce and exit:
High bounce and exit rates often result from usability issues such as cluttered layouts, weak visual hierarchy, or important elements placed below the fold. Heatmaps make these friction points visible by highlighting areas users ignore, hesitate on, or abandon early.
-
Supporting CRO and UX decisions with visual data:
Heatmap insights provide concrete behavioral evidence to support experiments to improve CRO and UX decisions. Instead of relying on opinions, teams can prioritize design, content, and layout changes based on how users actually interact with the store.
Top 12 Heatmap Tools to Scale Your Shopify Store
#1. Microsoft Clarity

Microsoft Clarity is a free user behavior analytics platform that provides heatmaps and session replays without traffic or recording limits. It helps merchants visualize on-page interactions and understand how visitors navigate their store by identifying engagement patterns, attention hotspots, and scrolling behavior.
Best for: Behavioral heatmaps and session replay analytics.
Key features:
-
Click heatmaps and session replays
-
Scroll heatmaps
-
Segmentation by device and traffic source
Pros:
-
Completely free with no traffic limits
-
Easy to install and runs with minimal setup
-
Provides both heatmaps and session replay insights
Cons:
-
Limited advanced segmentation and filtering
-
Fewer conversion optimization features than paid tools
-
Less detailed UX event tracking
Pricing: Free
#2. Hotjar

Hotjar is a well-known behavior analytics tool combining heatmaps, session recordings, and user feedback mechanisms. It helps merchants observe how visitors interact with pages and collect qualitative insights through surveys and polls. Shopify merchants use Hotjar to understand user intent, identify friction on key pages, and validate experience hypotheses.
Best for: Combined heatmaps, session recordings, and user feedback.
Key features:
-
Click, scroll, and movement heatmaps
-
Session recordings; feedback widgets
-
On-site surveys
-
Conversion funnel snapshots
Pros:
-
Intuitive interface suitable for non-technical teams
-
Combines quantitative and qualitative insights
-
Strong support resources and documentation
Cons:
-
Sampling and data retention limits on lower plans
-
Heatmap data can lag with very high traffic volumes
-
More expensive at higher usage tiers
Pricing:
-
Free tier available
-
Paid plans start from $39 - $213/month
#3. Heap Heatmaps

Heap Heatmaps automatically capture every user interaction without manual event tagging. It allows overlay behavior data on Shopify pages to show engagement distribution. Heap is used by data teams that want behavior visualization integrated with event analytics, enabling deeper cross-analysis with user paths and conversions.
Best for: Automatic event-driven heatmaps tied to analytics.
Key features:
-
Auto-capture of interactions
-
Heatmaps tied to event definitions
-
Funnel analytics, retention cohorts, behavioral segmentation
Pros:
-
No manual tagging needed, captures all interactions
-
Combines heatmaps with robust analytics context
-
Scalable for mid-sized to large brands
Cons:
-
Steeper learning curve for non-technical users
-
Can be costly as data volume grows
-
Interface can feel dense for newcomers
Pricing:
-
Free tier with limits.
-
Paid plans start from $39 – $79/month.
#4. Inspectlet

Inspectlet is a behavior analytics and session replay platform that records real user sessions and overlays heatmaps on page elements. It offers insights into both aggregate patterns and granular interactions. Merchants use Inspectlet to analyze where users hesitate, which fields in forms cause abandonment, and where visual attention clusters.
Best for: Detailed session replay and form interaction heatmaps.
Key features:
-
Click/attention heatmaps
-
Session recordings with timeline playback
-
Form analytics
-
JavaScript error logging
Pros:
-
Precise session replay for detailed UX diagnosis
-
Form analytics reveals field-level friction
-
Good for troubleshooting specific UX issues
Cons:
-
User interface is less modern than competitors.
-
Limited advanced segmentation
-
More expensive with many sessions
Pricing: $39–$79/month
#5. Plerdy

Plerdy is an all-around behavior and optimization platform combining heatmaps with conversion tracking and SEO audit features. It allows merchants to see engagement patterns while identifying potential conversion killers. Plerdy is used by Shopify merchants who want a combined view of heatmaps, SEO opportunities, and conversion data without juggling multiple tools.
Best for: Heatmap data with SEO and conversion insights.
Key features:
-
Click and scroll heatmaps
-
Conversion funnels
-
SEO metrics
-
Dynamic event tracking and pop-up triggers
Pros:
-
Broad feature set beyond heatmaps
-
Affordable relative to specialized tools
-
Supports SEO alongside UX analytics
Cons:
-
Heatmap segmentation is less advanced than specialist tools
-
Some UX teams may find the interface busy
-
Fewer integrations than market leaders
Pricing:
-
Free plan available.
-
Paid plans start from $26 – $32/month.
#6. Lucky Orange

Lucky Orange is an integrated behavior analytics suite offering heatmaps, session recordings, funnels, and real-time live chat. It helps merchants not only track behavior but also engage visitors in real time. Shopify merchants use Lucky Orange to diagnose friction points and directly engage users for feedback or support.
Best for: Heatmaps with real-time behavior and visitor engagement tools.
Key features:
-
Heatmaps and session replay
-
Conversion funnels, live chat, form analytics
Pros:
-
Real-time insights and engagement
-
Combines multiple behavior tools into one
-
Easy to install and interpret
Cons:
-
If misconfigured can impact page performance
-
Live chat may overlap with other tools
-
Can be expensive for high-traffic sites
Pricing:
-
Free trial available.
-
Paid plans start from $32 - $144/month.
#7. Crazy Egg

Crazy Egg is a classic heatmap platform focused on simplicity and fast insights, offering clickmaps, scrollmaps, and basic experimentation features. Merchants use Crazy Egg to quickly visualize attention areas and make rapid layout decisions.
Best for: Straightforward click and scroll heatmaps with basic A/B support.
Key features:
-
Click/scroll heatmaps
-
Snapshot reporting
-
Basic A/B testing and trend comparison
Pros:
-
Easy to use with fast heatmap setup
-
Clean visual reports
-
Good for quick CRO insights
Cons:
-
Limited advanced analytics
-
Funnels and session replay are not as robust as others
-
Less segmentation depth
Pricing: Starts from $29 - $499/month.
#8. Mouseflow

Mouseflow blends heatmaps with funnels and session replay, focusing on journey-level behavior analytics. Its strength lies in follow-through from entry to conversion or exit. Shopify merchants use Mouseflow to understand how users traverse the site and where they fall out of key flows.
Best for: Funnel and session replay-enhanced heatmap insights.
Key features:
-
Heatmaps and session replay
-
Funnel tracking
-
Form analytics and segmentation
Pros:
-
Strong journey visualization
-
Detailed form insights
-
Deep segmentation
Cons:
-
Higher cost at scale
-
Can be data-heavy to configure
Pricing:
-
Free plan available
-
Paid plans start from $31 - 159/month.
#9. Smartlook

Smartlook emphasizes event tracking and mobile behavior, offering heatmaps alongside robust event analysis. It shines where mobile traffic dominates. Merchants use Smartlook to tie specific actions (e.g., taps, swipes) to heatmap data and segment behavior by device.
Best for: Mobile-first analytics and event-driven insights.
Key features:
-
Heatmaps and session playback
-
Event tracking
-
Funnels and cross-platform insights
Pros:
-
Strong mobile interaction tracking
-
Event-based analysis
-
Useful for hybrid web/app stores
Cons:
-
Interface complexity
-
Less intuitive for beginners
Pricing:
-
Free plan available
-
Paid plans start at $55/month.
#10. Instapage

Instapage is a landing page optimization platform that includes heatmaps as part of its page experimentation suite. It is focused on campaign landing optimization rather than full site behavior. Shopify brands use Instapage when running campaign-specific landing pages to maximize conversion before traffic reaches core product pages.
Best for: Campaign landing page heatmaps and experiments.
Key features:
-
Heatmaps
-
A/B testing
-
Landing page editor and personalization.
Pros:
-
Excellent landing page tools
-
Heatmaps integrated with experiments
-
Fast visual editor
Cons:
-
Limited site-wide UX insights
-
Requires a separate workflow from the main store analytics
Pricing: $79/month.
#11. Viindoo

Viindoo provides behavior tracking and analytics tied to CRM and lifecycle data, enabling merchants to connect UX insights with customer segments. Brands that want UX data linked to CRM use Viindoo to see how behavior differences align with value segments.
Best for: Heatmaps integrated with CRM-linked customer behavior analytics.
Key features:
-
Behavioral heatmaps
-
User segmentation
-
CRM integration and journey analytics
Pros:
-
Bridges UX and customer data
-
Good for personalized experiences
-
Lifecycle insights
Cons:
-
Not as Shopify native as others
-
More complex setup
Pricing: Custom pricing
#12. Sprig

Sprig is a behavioral research and feedback platform with in-product surveys and user feedback tools, supplementing heatmaps with user voice. Merchants use Sprig to gather qualitative insights that explain why users behave as they do.
Best for: Behavioral research and in-product feedback with heatmap support.
Key features:
-
Heatmaps
-
In-product surveys and feedback prompts
-
Behavioral analytics
Pros:
-
Strong qualitative context
-
Great for hypothesis generation
-
Complements traditional heatmaps
Cons:
-
Less traditional heatmap depth
-
Focused on feedback more than visualization
Pricing: Custom pricing
#13. Fullstory

FullStory is a high-resolution analytics platform offering advanced heatmaps, session replay, and error tracking, designed for precision. High-traffic Shopify Plus merchants use FullStory to capture detailed interaction data and uncover technical or experience bugs.
Best for: High-resolution interaction analytics with heatmaps and error tracking.
Key features:
-
High-resolution heatmaps and session replay
-
Conversion analytics
-
Error and performance tracking.
Pros:
-
Deep visibility into behavior
-
Excellent for technical and experience debugging
-
Scales with data volume
Cons:
-
High cost
-
Enterprise-level complexity
Pricing: Custom pricing
#14. Contentsquare

Contentsquare is an enterprise digital experience platform that provides heatmaps, journey analysis, impact scoring, and advanced behavioral insights. Large Shopify brands and enterprise teams use Contentsquare to align UX improvements with strategic revenue impact.
Best for: Enterprise digital experience analytics with advanced journey heatmaps.
Key features:
-
Click/scroll maps and zone analytics
-
Journey performance scoring and AI-driven insights.
Pros:
-
Advanced analytics at scale
-
Insight scoring and prioritization
-
Comprehensive experience maps
Cons:
-
Enterprise pricing
-
Steeper learning curve
Pricing: Paid (custom pricing).
How to Choose the Right Heatmap Tools for Your Store
Choosing the right heatmap tools for your Shopify store requires more than picking the most popular name. The right solution should align with your business goals, technical requirements, and optimization strategy.
Checklist to choose the right heatmap tools:
1. Shopify compatibility and ease of setup
Ensure the tool integrates with Shopify themes and dynamic sections, preferably via a native app. Faster setup means quicker access to insights and fewer technical dependencies.
2. Accuracy of behavioral tracking
Look for tools that can capture clicks, scroll depth, and cursor movement with minimal data sampling. Accurate tracking is essential for identifying friction points and user intent.
3. Performance impact on store speed
Heatmap scripts should load asynchronously and avoid blocking critical rendering. A good tool provides behavioral data without slowing down page load or hurting Core Web Vitals.
4. Data privacy and compliance
Confirm support for GDPR and CCPA compliance, including IP masking, data anonymization, and consent.
5. Pricing and scalability for growing stores
Review pricing tiers based on sessions, data retention, and features. Choose a tool that scales gradually with traffic growth rather than forcing costly upgrades too early.
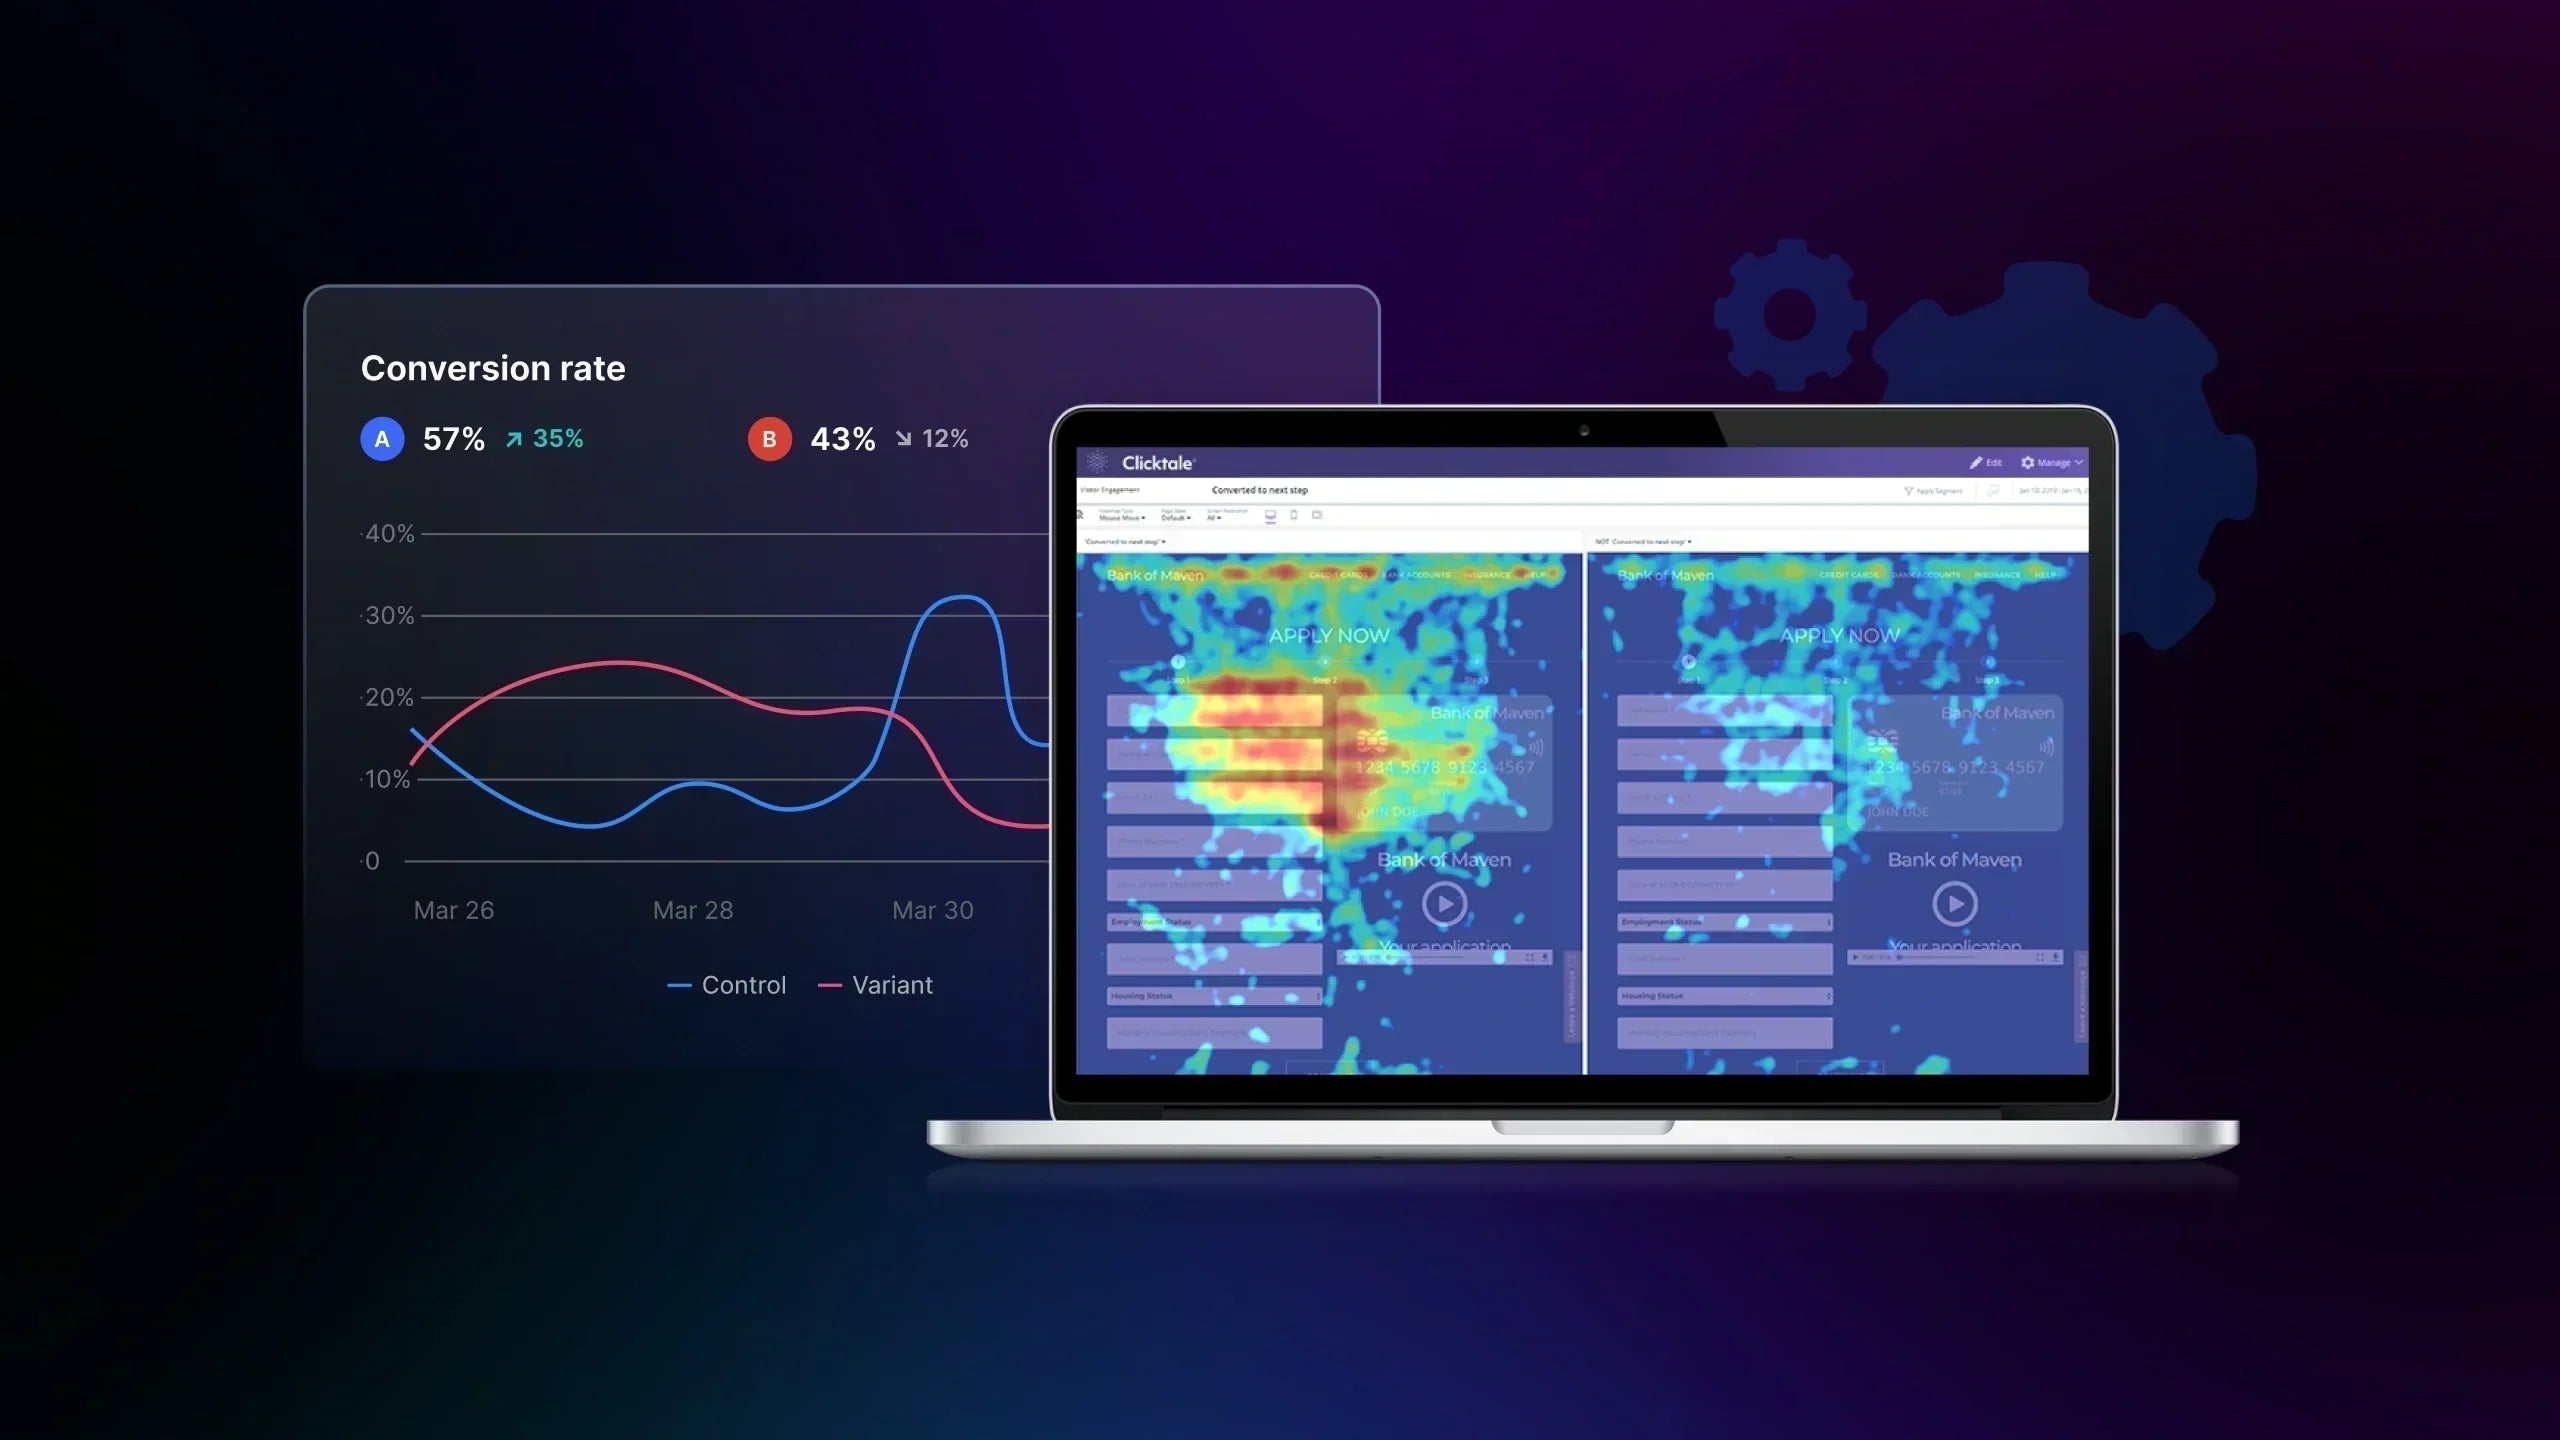
Heatmap tools and A/B testing: Turn insights into impacts
Heatmap tools are descriptive, not prescriptive. They highlight attention patterns and friction points, but they cannot determine causality or quantify uplift. To turn visual insights into measurable growth, heatmap findings must be paired with A/B testing to validate causality and quantify conversion impact.
Identify friction points to pinpoint underperforming elements
Heatmap insights make it immediately visible where users hesitate, stop scrolling, or abandon interaction altogether. By analyzing click density, scroll depth, and cursor movement, merchants can detect elements that create confusion or fail to meet user expectations, such as overcrowded hero sections, poorly placed product information, or distracting design components.
These friction points often explain high bounce rates and low engagement more effectively than traditional metrics alone, providing a visual foundation for targeted optimization.
Prioritize A/B tests in high-attention areas that influence CRO
Heatmap tools can strongly enhance A/B testing by visualizing where users click, pause, scroll, or disengage. This reveals which elements drive engagement or ignorance. Through this, merchants design meaningful experiments, ensuring that A/B tests focus on changes that have the highest potential to improve conversion rate optimization (CRO).
When combined with GemX, heatmap data becomes more actionable. For example, a heatmap provides insights into high-attention zones, such as hero sections, primary CTAs, pricing tables, or trust badges, to guide GemX experiments by showing what to test, where to place variations, and which changes will impact conversions. With smarter A/B testing and data-driven analytics for experiments and all store pages, GemX can validate if those changes reduce bounce rate and lift performance.

In 2026, GemX is going to introduce a built-in heatmap feature! This will let merchants see exactly how visitors interact with a page and instantly use that data to guide experiments and optimization decisions. It’s designed to make turning user behavior into conversion improvements much easier and smoother.
Validate users' on-page interaction
Heatmaps often reveal a gap between how a page is designed to be used and how visitors actually interact with it. Users may ignore prominent CTAs, overlook trust badges, or focus attention on non-clickable elements, signaling misalignment between intent and execution.
By comparing intended interaction paths with real user behavior, merchants can uncover ineffective hero messaging, misplaced calls-to-action, or underutilized credibility elements. These insights allow teams to refine layouts and messaging so that user attention aligns more closely with conversion goals.
Common Mistakes When Using Heatmap Tools
Even powerful heatmap tools can lead to poor decisions if they are not used correctly. Avoiding mistakes helps ensure that heatmap insights support growth rather than create confusion.
Mistake #1: Interpreting heatmap data without contextual analytics
Heatmaps show where users click, scroll, and hover, but they do not explain those actions. A cluster of clicks on an element does not always indicate success but rather signals confusion. Without metrics such as conversion rate or funnel drop-offs, merchants may misinterpret behavior and optimize the wrong elements. Combining heatmap insights with analytics and experiment results is essential for accurate decision-making.
Mistake #2: Ignoring mobile and desktop behavior differences
User behavior varies significantly between devices. Mobile visitors’ on-page behaviors are different from desktop users. Treating heatmap data as an unidimensional experience can ignore serious usability issues, especially regarding mobile checkout and navigation. Heatmaps should always be reviewed separately for mobile and desktop to uncover device-specific friction points.
Mistake #3: Over-testing without hypothesis prioritization
Heatmap tools can drive many improvements, but testing everything at once dilutes focus and resources. Running too many low-impact tests leads to slow learning and unclear results. Without a structured prioritization plan, merchants may optimize minor elements while ignoring greater changes. Heatmap insights should feed into clear testing plans that focus on the highest-impact opportunities.
Conclusion
Heatmap tools provide clear views into real customers' interactions with your Shopify store. When combined with analytics and experimentation, these insights can greatly boost conversion and user experience.
Choosing the right heatmap tools allows merchants to make evidence-based decisions that improve usability, reduce bounce rate, and increase revenue. Used properly, heatmaps are not just a reporting layer but a strategic asset for sustainable growth.
FAQs about Heatmap Tools


